WHY WE BUILT IT

A lux meter tells you how much light; it doesn't tell you what kind

We wanted the power to see what a luminaire was actually emitting in the palm of our hand. So we built the meter we wanted.

  • Growers. See a grow light's estimated spectrum across 380–780 nm, compare fixtures side by side and check their estimated blue-to-red balance. Check lights for flicker, and compare estimated UVA and near-infrared output between fixtures.
  • Lighting design and commissioning. Check that the fixtures on site match the ones you specified. Compare CCT, Duv and estimated CRI, R9 and TM-30 against the datasheet, check for flicker, and compare samples before you approve them. Walk a job fixture by fixture and save each reading as a timestamped file for the punch list.
  • Museums and galleries. A pocket survey meter for gallery walk-throughs. Spot-check illuminance (lux) on each display against its light-level target, check the estimated UV ratio in µW/lm near sensitive objects and save each reading as a dated file for your records.
  • Film and video. Match fixtures before the shoot by comparing CCT, Duv and spectrum, and see what you're mixing when daylight, practicals and LEDs share a scene. Check for flicker within the sensor's bandwidth before it shows up on camera, and look at the spectrum to see why a light renders skin tones the way it does.
  • Circadian and wellness lighting. See how much of a light's spectrum sits in the blue range and compare sources side by side. Melanopic EDI is reported as an estimate.
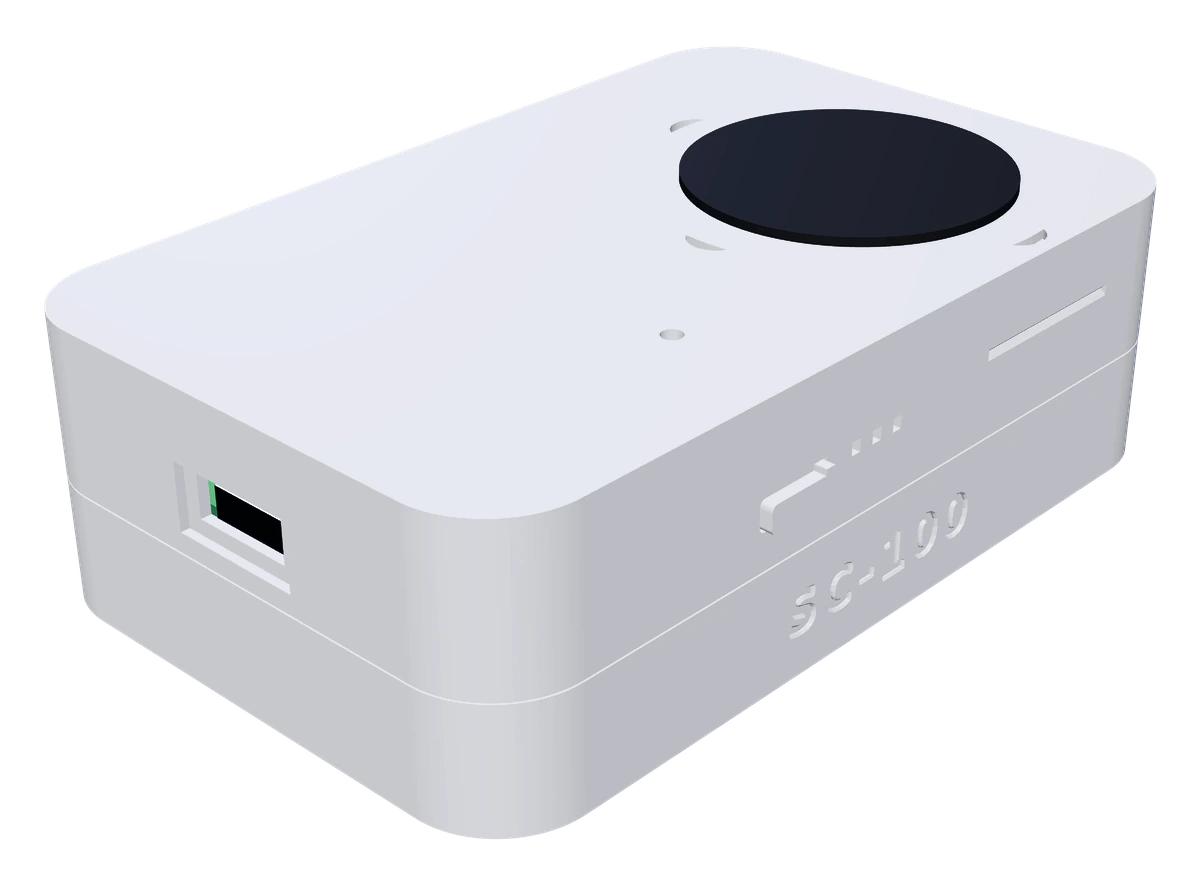
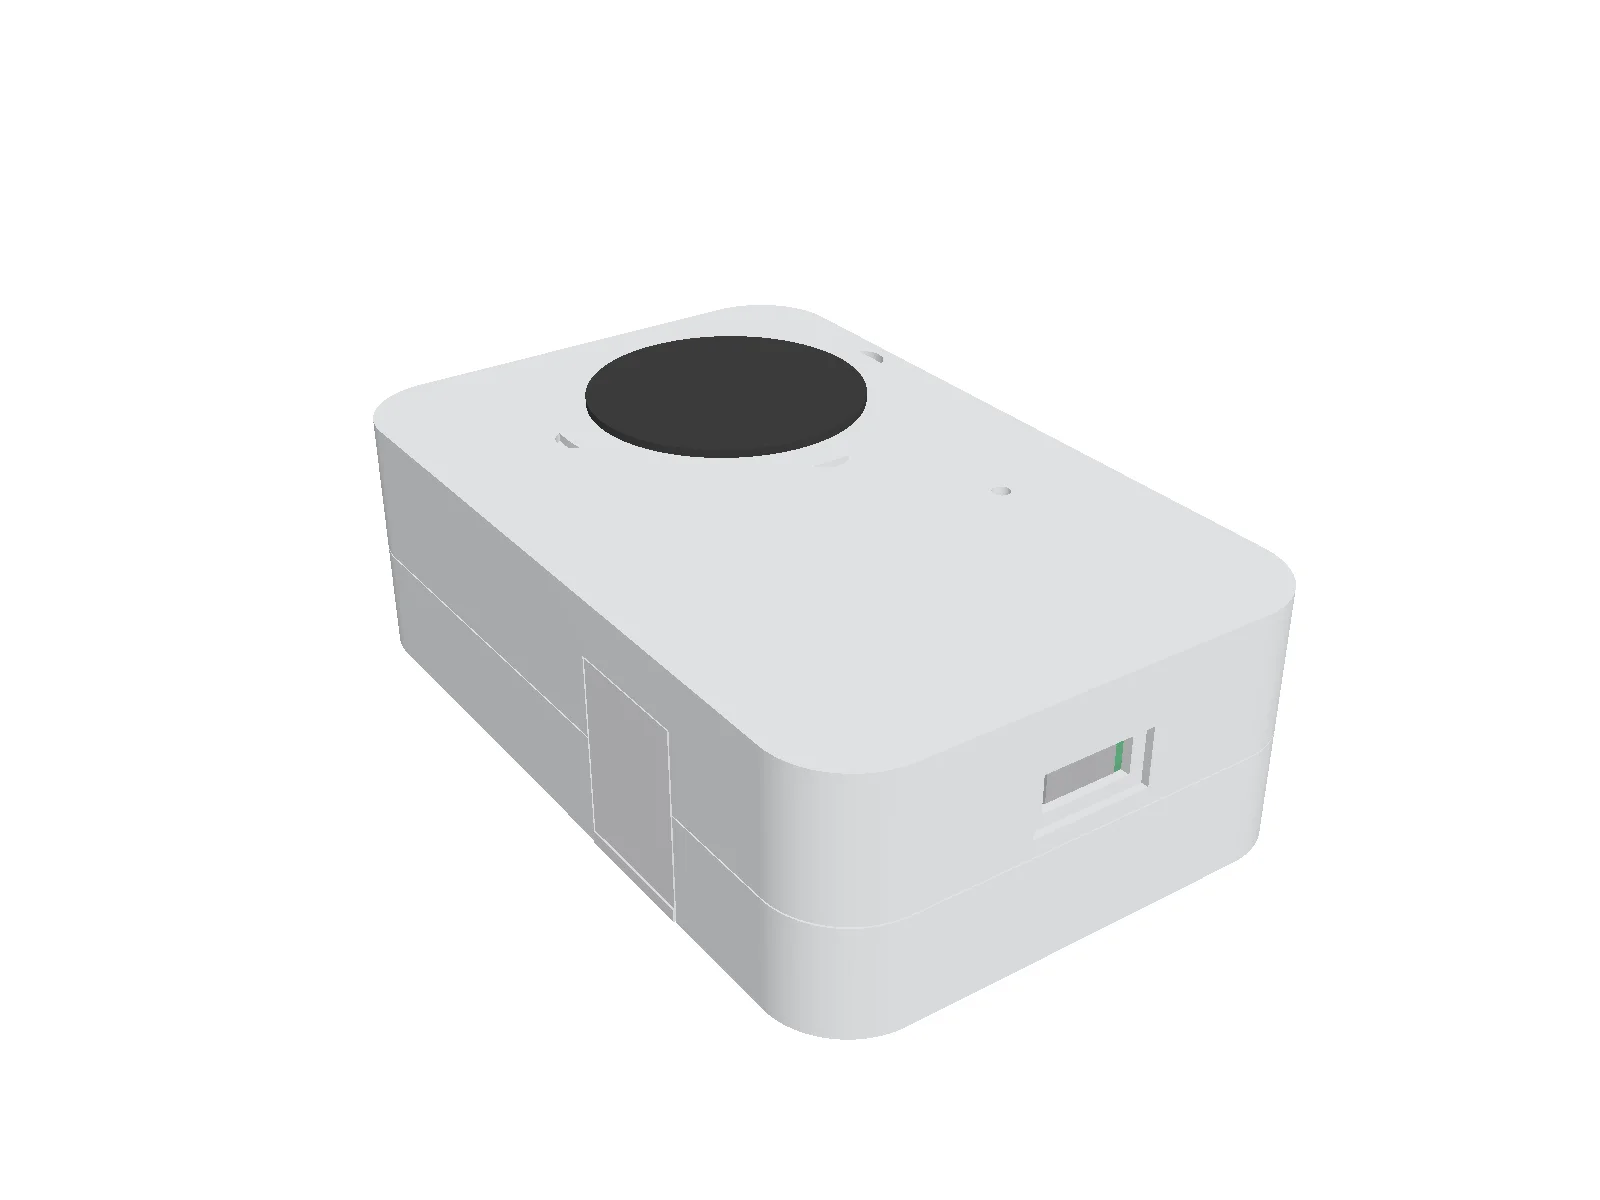
Rendering of the Spectral Companion SC-100 3D model, assembled
INTERACTIVE MODEL · CASE COLOR NOT FINAL

THE HARDWARE

Take it apart

This is the current design, straight from our CAD. Turn it around, zoom in, and press Explode to see how the case, board and battery fit together.

Simplified model for the web. Details may change before first units ship.

MEASUREMENTS

What it measures

Spectral power distribution (SPD)
How much light a source gives off at each color, or wavelength, across the visible range from violet to deep red. Two lights with the same lux reading and color temperature can have very different spectra.
Flicker
Percent flicker is how much the light's output swings between its brightest and dimmest moments in each cycle. PstLM is a unitless score for how visible slow flicker is to people: at 1, about half of viewers would notice it.
UVA
UVA irradiance, in W/m², is the ultraviolet power just below violet that reaches a surface. The UV ratio, in µW/lm, is UV power per lumen of visible light, the figure museums use to protect sensitive objects. UV percentage is UVA's share of a light's total radiant power.
Near-infrared
Near-infrared irradiance, in W/m², is the light power just beyond red that falls on each unit of surface area, in a band of roughly 830–1000 nm that carries much of a lamp's radiant heat. It's useful around heat-sensitive subjects.
Color rendering (CRI, R9, TM-30)
How faithfully a light shows colors compared with a reference source. CRI Ra is the familiar single score, R9 covers saturated reds, and TM-30 reports fidelity (Rf) and gamut (Rg).
Scotopic illuminance and S/P ratio
Scotopic illuminance weights light by night (rod) vision, which favors bluer wavelengths. The S/P ratio compares it with ordinary (photopic) illuminance. A higher ratio means a light may look brighter in dim conditions than its lux reading suggests.
R:FR and PSS
R:FR compares red to far-red light, and PSS estimates how a plant's phytochrome responds to that balance. Together they hint at stretch, flowering and shade response.
Daily light integral (DLI)
Daily light integral (DLI), in mol/(m²·d), is the total plant light a spot gets in a day. It shows whether a crop is getting enough light, and how long to run grow lights.
Result labels
Every reading carries a label (Calibrated reading, Estimate, Compare only, Not shown, Unavailable or Can't read this record) so you know how far to trust each number.
ReadingUnitsType
IlluminancelxMeasurement
Scotopic illuminancelxEstimate
S/P ratiounitlessEstimate
IlluminancefcMeasurement
Color temperature, tint (near-white light)K · DuvMeasurement
Chromaticityx, y · u′, v′Measurement
Plant light (horticulture mode)PPFD · µmol/(m²·s)Measurement
CRI and R9Ra · R9Estimate
TM-30Rf · RgEstimate
Percent flicker, within the sensor's bandwidth%Measurement
Flicker frequencyHzMeasurement
IrradianceW/m²Measurement
Flicker visibilityPstLMEstimate
UVA irradiance, UV ratioW/m² · µW/lmEstimate
UV percentage (UVA share)%Estimate
Near-infrared irradianceW/m²Estimate
Melanopic EDIlxEstimate
Red to far-red ratio (R:FR)unitlessEstimate
Phytochrome photostationary state (PSS)unitlessEstimate
Daily light integral (DLI)mol/(m²·d)Measurement

The app labels each value on screen, so you always know which numbers are estimates.
OPTICAL CHANNELS

Many channels, one view of your light

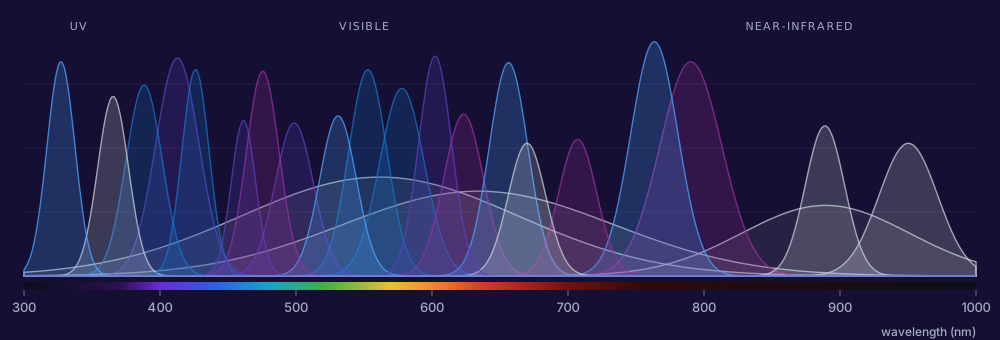
About two dozen optical channels cover UV, visible and near-infrared light. The app combines the visible channels into one estimated spectrum and reports UV and near-infrared as separate estimates.

Illustrative chart of overlapping bands covering UV, visible and near-infrared wavelengths from 300–1000 nm
Illustrative. Spectral coverage of the SC-100's optical channels, from UV to near-infrared. Band shapes are simplified.

THE APP

Your phone is the screen

The app does every calculation on the phone and works with no signal at all. There's no account to make and nothing goes to a cloud.

Export
CSV and JSON export, files you keep
Open API
Wireless interface for your own scripts (public documentation)
Clear labels
Estimates are marked on every card
Live Color quality and color temperature at a glance
Spectrum The estimated spectrum, with readings grouped in tabs
Compare and export Freeze two readings, compare them and save the file

Screens shown are simplified design mockups with example values.

CALIBRATION

Each meter comes with its own record

Each unit is calibrated on our own jig before it leaves. The record for that serial number comes in the box and loads into the app, so you know which meter took which reading.

LIMINAL PHOTONICSEXAMPLE

Calibration record

Spectral Companion SC-100

ModelSpectral Companion SC-100
Serial numberLP1-000000
Calibration dateYYYY-MM-DD
Firmware versionx.y.z
Spectral readingsPass
Color readingsPass
UVA and flicker readingsPass
Record ID0000-0000-0000
Checked by ____Page 1 of 1

SPECIFICATIONS

Specs

Size65 × 100 × 32 mm
Enclosure3D-printed ASA
ConnectionWireless, open API (public documentation) · USB-C®
PowerRechargeable over USB-C
Mounting¼″-20 tripod thread
AppOffline · no account · no cloud
CalibrationEach unit is calibrated on our own jig, with its own calibration record
RecordsTamper-evident saved readings, so you can show a reading hasn't been changed since it was taken
ExportCSV and JSON export

Prototype design. Details may change before first units ship.

Measure light for a living?

On set, in a gallery, in a grow room or on a commissioning walk-through: tell us what you'd use it for. The Spectral Companion SC-100 is in development and not yet for sale, and we'll keep you posted.

Opens your email app with a message to contact@liminalphotonics.com.